
Episode 2 of 10: The Financial KPI Landscape

A visual overview of revenue scale, growth, and returns (FY24)
This lighter, visual-led episode explores the diversity of the grocery retail commercial landscape. While the top 100 grocery retailers share common commercial characteristics, their relative performance remains highly diverse.
The Profitability and Growth Variance
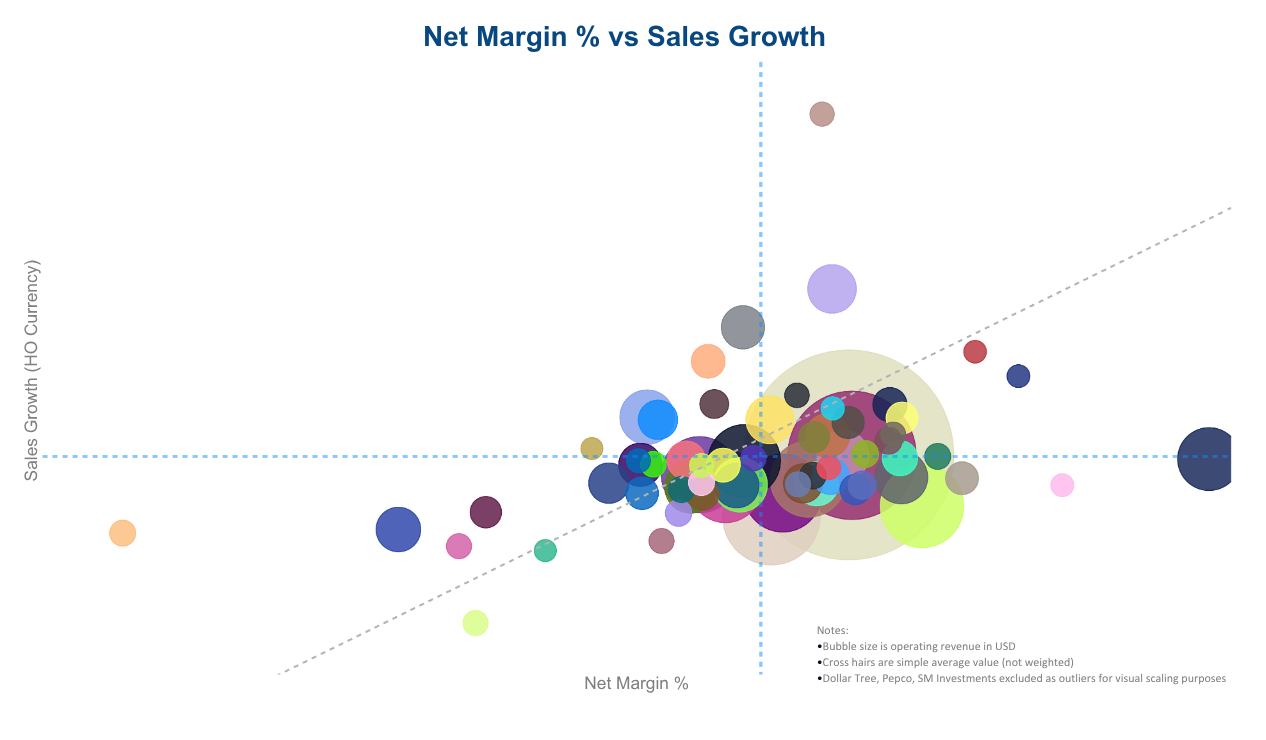
- Net Margin vs. Sales Growth: Profitability levels are intrinsically low in grocery retail, with an average net margin across the top 100 of 2.16%. Sales Growth in Head Office currency averaged 4.8% globally for the top 100. The above graph illustrating Sales Growth vs. Net Margin % shows a commercial landscape with considerable variance around the average, particularly regarding profitability compared to sales growth.
- Scale and Profitability: There is a directional correlation between retailer size (represented by bubble size in our analysis) and profitability. Scale plays a vital role in grocery P&Ls due to operational gearing effects, as small increases in revenue have an amplified impact on profitability given the relatively high level of fixed costs in grocery retailers.
The Predictors of Return (ROA)
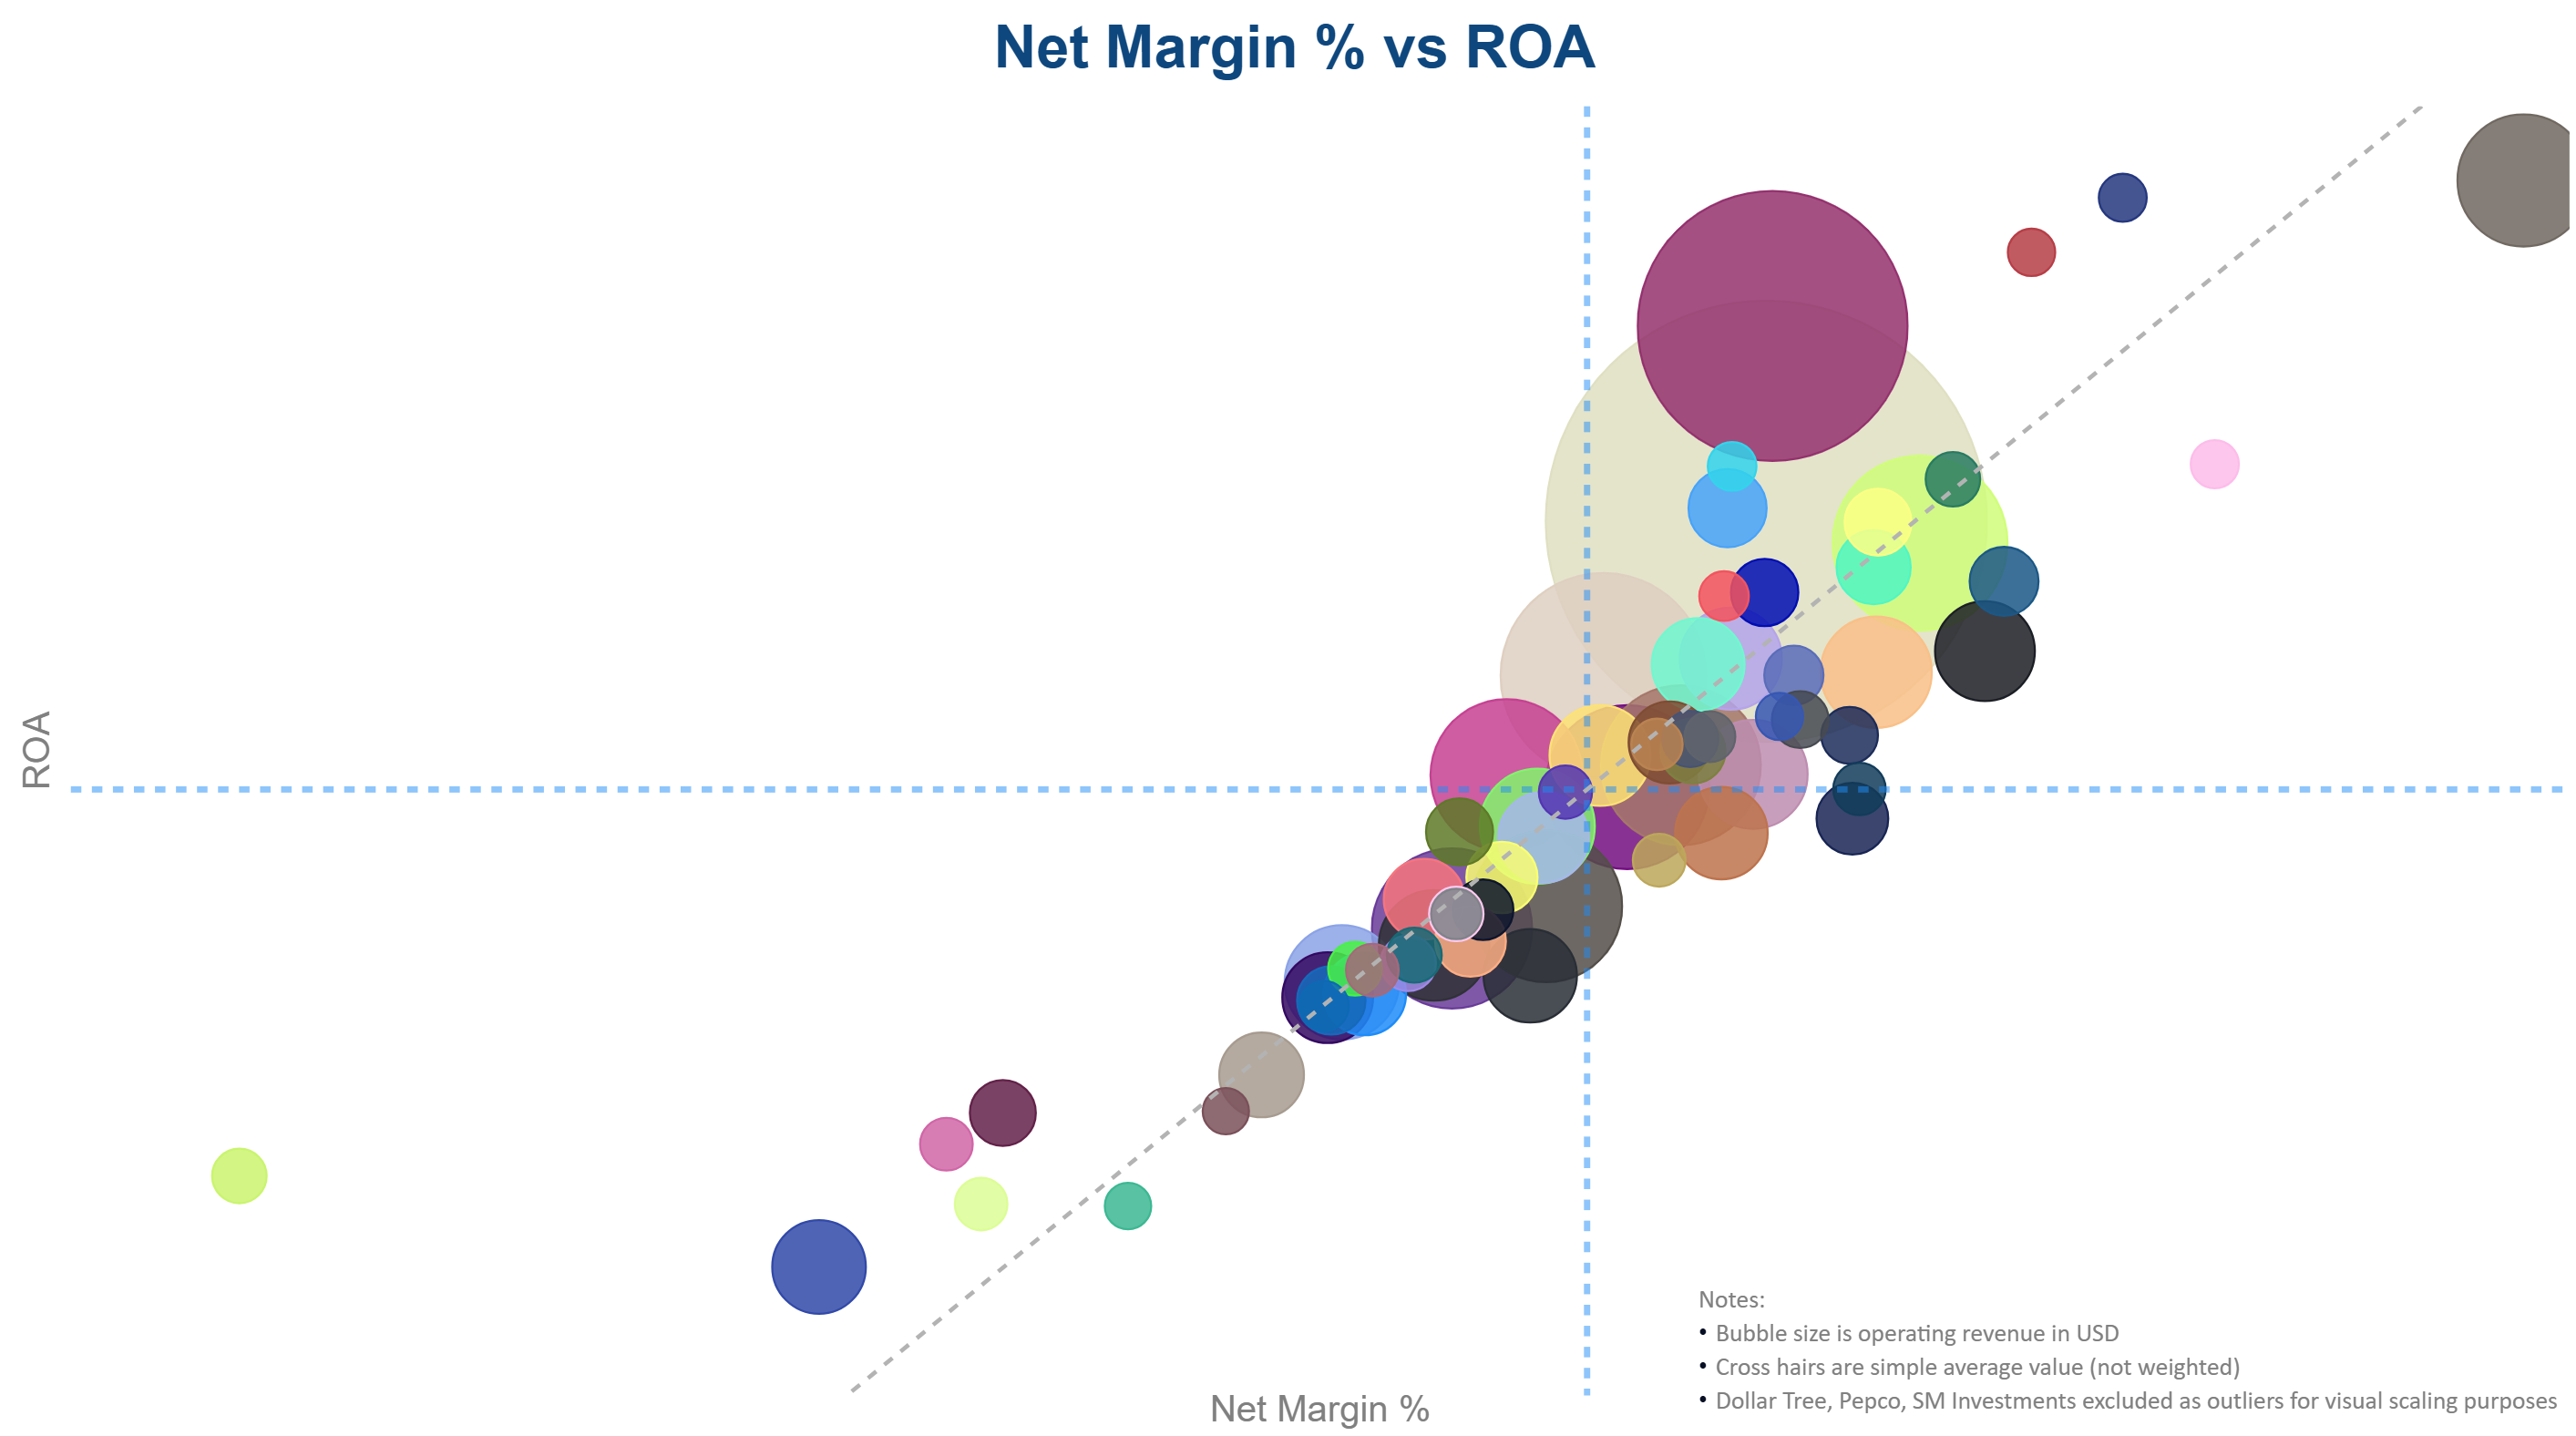
- The Margin Connection: Net margin shows a particularly strong and expected correlation to Return on Assets (ROA). This relationship is reinforced by the link between retailer size and profitability, given the importance that scale plays in grocery retailer P&Ls.
-
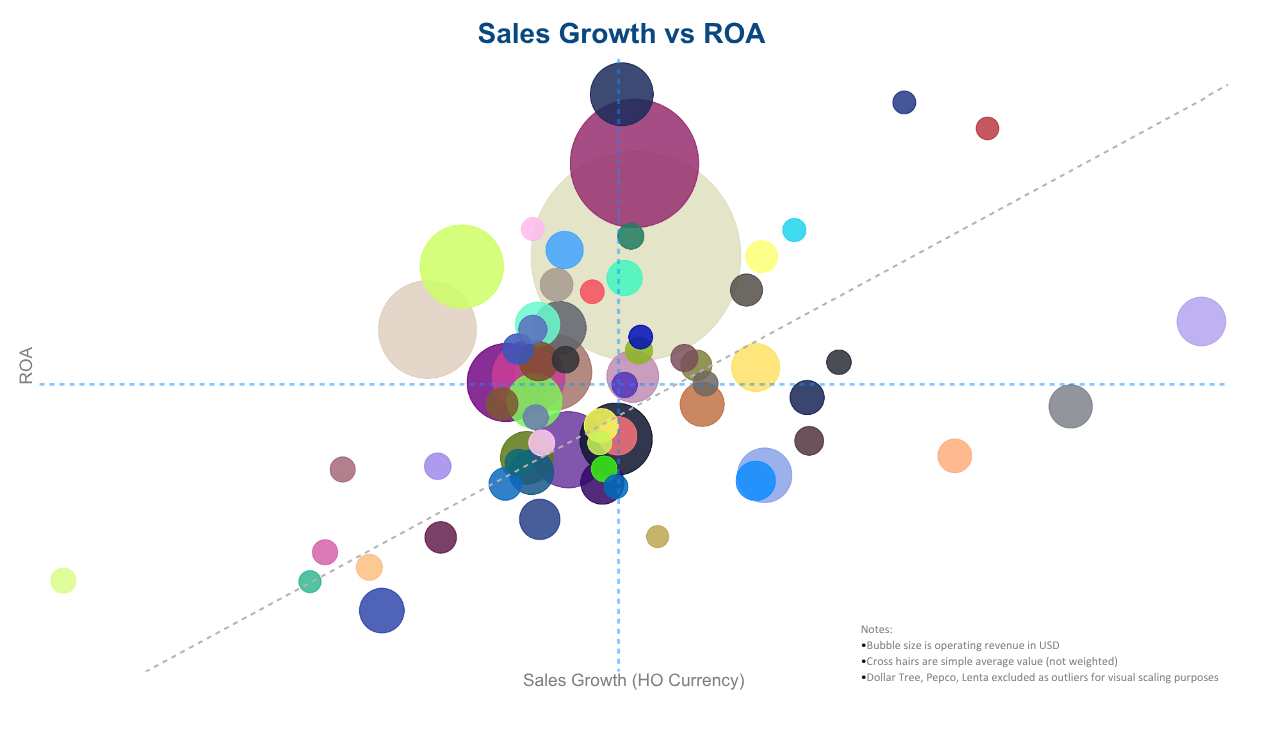
- Growth as a Secondary Lever: Sales growth is a less strong predictor of returns for grocery retailers than net margin levels. However, because sales growth improves scale and efficiency (a key value creation driver for grocery retailers), it still contributes to differentiating return levels across the top 100.

Enjoying the series?
Subscribe to get access to each future episode delivered straight to your inbox, as they become available
Subscribe for the full series on our Resources page
This series is a curated version of our full report which covers wider analysis and reporting supported by more extensive graphics and tables than this headline episode format allows. It also includes a ranked table of the top 100 global grocery retailers. Look out on our Resources page for future releases and where you can also get in touch with us to learn more.
Notice
© Comsensus Limited. All rights reserved.
These materials may not be reproduced or distributed in part or in full, in any form or by any means, electronic or mechanical, including photography, recording, or any information storage and retrieval system now known or to be invented, without the express written permission of Comsensus Limited.
These materials may not be reproduced or distributed in part or in full, in any form or by any means, electronic or mechanical, including photography, recording, or any information storage and retrieval system now known or to be invented, without the express written permission of Comsensus Limited.
Disclaimer
The data, information and analysis contained in these materials represent the opinions of Comsensus Limited. The views expressed do not necessarily reflect the views of the management of the business(es) under discussion. These materials are not endorsed or otherwise supported by the management of any of the companies or organizations discussed herein. Nothing in these materials constitutes financial advice in any way whatsoever, nor should any data or content be relied upon for any investment activities.