
Episode 1 of 10 — The Grocery Retail Commercial Landscape:

The grocery industry continues to navigate shifting economic conditions, evolving shopper behaviours, and intensifying competitive dynamics. Episode 1 sets the foundation for this 10 part series by presenting a high level view of the world’s Top 100 global grocery retailers, including a “Headlines at a Glance” infographic to summarise the commercial landscape.
Headline Performance (FY24)

The Top 100 grocery retailers generated $3.63 trillion in revenues in FY24, an increase of 1.3% year on year. This is a marked slowdown relative to the 5.7% growth seen in FY23 (USD terms). Underlying performance was stronger, with constant currency growth averaging 4.8%, reflecting year-on-year regional inflation and foreign exchange rate impacts. Regional growth profiles – linked also to differing retail format growth and mix by region – also plays a key role in this global growth picture. We will explore both regional and retail format performance in greater depth in later episodes of this series.
Power continues to concentrate with the top 5 retailers now representing more than 38% of all Top 100 revenues – an increase of 0.6 percentage point share. Viewed another way, the combined revenues of the leading retailers in each of the 6 retail formats covered in this series accounted for just under 40% of Top-100 revenues. These 6 retailers delivered 3% aggregate growth compared to the 0.21% for the other 94 retailers. This growing concentration shapes commercial leverage, investment priorities, and negotiation dynamics—critical factors for consumer goods teams.
Regional Revenue Patterns

North America and Europe dominate the Top 100 landscape, together accounting for over 87% of revenues. North America’s share increased in USD terms, supported by FX trends and operational resilience. Europe saw a decline in share in USD terms driven by currency movements and ongoing competitive intensity.
At a country level, 5 countries (the United States, 3 European countries and Japan) account for almost three quarters of the top 100 global grocery retailer revenues.
Beyond the large developed markets, Asia Pacific was well represented in the Top-100 with 19 retailers, Latin America delivered the fastest growth in constant-currency terms (9.3%), and Africa & Middle East posted the strongest USD growth from a smaller base. For consumer goods companies, these markets continue to grow in relevance for long term portfolio diversification.
Format Dynamics
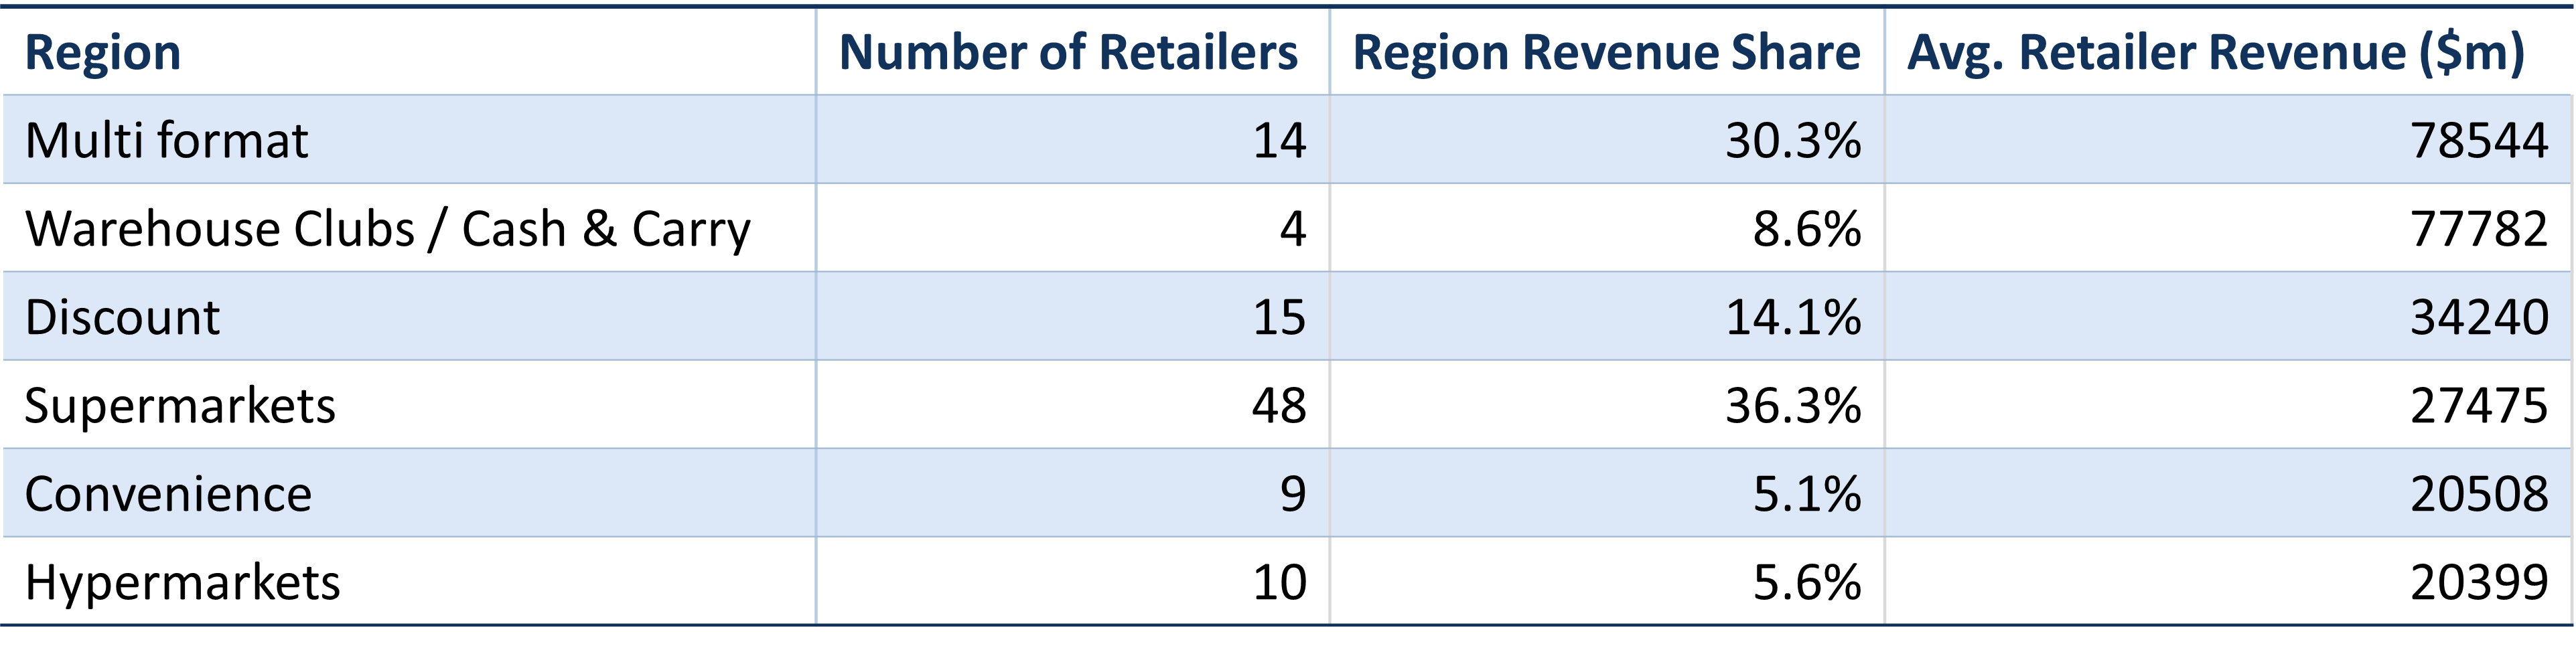
- Supermarkets remain the largest format (36.3%) but delivered below average growth in both USD and constant-currency terms.
- Multi format retailers and warehouse clubs deliver the highest revenues per retailer, driven by concentrated retailer leadership and broad channel reach.
- Discounters (14.1% share) continue to capture value seeking shoppers and posted strong constant currency growth at 5.8%.
- Convenience was the smallest but fastest growing format in constant-currency terms at 7%, supported by regional relevance and consumer trends toward proximity shopping.
- Hypermarkets continue to feel structural pressure from format shifts and competition, experiencing below average growth levels that also lagged behind the Supermarket format.
The above headlines align to the wider trends in retail economics of stronger growth in value and convenience retail formats relative to super and hyper-market retail formats, with many multi-format retailers still in transition to successfully scaling omnichannel retail models.
These shifting dynamics directly impact revenue management strategies at a category and channel level, the design and evolution of supplier go-to-market strategies, and the landscape for value creation and joint business planning between retailers and suppliers.
Financial Performance & Returns
FY24 saw modest improvements in profitability across the Top 100. Net margins reached 2.2% (operating margins also improved slightly) and ROA held at 3.9%. However, average efficiency declined by just over 5%, driven in part by the declining growth levels in FY24 vs 2023 and the headwind this created for cost-heavy retailer operating models.
Regionally, North America led in profitability and returns, while Europe faced competitive headwinds and lower margins. In terms of retail formats, warehouse clubs and discounters excel in efficiency and asset utilization, correlating with above average returns relative to the other retail formats.
Implications for Consumer Goods Professionals
The grocery retail commercial landscape presents challenges and opportunities around slowing growth and growth concentration trends, underlying margin and efficiency pressures, and evolving consumer and shopper preferences.
Commercial teams working with grocery retailers will need to be ever more commercially agile in order to identify and unlock value driving opportunities that are relevant at a regional and retail format level.
Episode 1 highlights several key implication areas for retailers and for suppliers:
- Reflect regional relevance in category and channel strategies and long term planning.
- Adapt JBP models and value creation frameworks to format specific dynamics.
- Sharpen customer prioritisation and strategy as growth slows and power concentrates.
- Accelerate commercial agility and capability in strategic and operational planning and in the deployment of revenue management levers.
In future episodes of this 10-part series we will explore each of the headline topics that have been summarised in this introductory episode to provide a comprehensive insight into the performance dynamics and drivers of the Top 100 Global Grocery Retailers.

Enjoying the series?
These materials may not be reproduced or distributed in part or in full, in any form or by any means, electronic or mechanical, including photography, recording, or any information storage and retrieval system now known or to be invented, without the express written permission of Comsensus Limited.